How to Read a UK Weather Forecast: Symbols, Probability and Gust Speeds Explained
Most of us check the weather the way we check the time: quickly, on autopilot, and usually while doing something else. You glance at a small cloud with a raindrop, decide it looks fine, and then get caught in a shower twenty minutes from home with no hood.
A forecast packs a lot of information into a very small space. Once you know what the symbols, percentages and gust figures are actually telling you, that quick glance becomes genuinely useful — whether you are choosing a coat, planning a walk, or deciding whether the washing can go out.
Symbols are shorthand, not a promise
Forecast icons show the most significant weather expected in a given hour or block of hours. That word "most significant" matters. If a three-hour block contains 20 minutes of heavy rain and two hours of bright sunshine, the icon will usually show rain, because that is the part of the period you need to know about.
Many apps also use day and night versions of the same symbol, so a sun becomes a moon after sunset. Some show a combined icon: a cloud with a sun and a small raindrop means cloud and sun are the main story, with a shower as a secondary possibility.
- Sun and part-cloud: mostly dry, some brightness. Short showers still possible.
- Cloud: overcast, grey, usually dry but often chilly and still.
- Light rain versus heavy rain: light is drizzle or patchy; heavy means persistent or intense, often with poor visibility.
- Showers: hit and miss by nature. Your neighbour may stay dry while you get soaked.
- Sleet and snow: sleet is a mix of rain and snow, often painful in a headwind. Snow icons usually indicate wintry showers rather than guaranteed settling.
- Thunder, hail, fog: short, sharp, and worth planning around — fog especially if you are driving early.
What the percentage actually means
The percentage beside a raindrop is usually the chance that rain will fall at your location during that period. It is not a measure of how heavy the rain will be, and it is not the share of the country that will get wet. Definitions vary slightly between providers, so it is worth checking the wording in whichever app you use.
Chance of rain versus amount of rain
A 90% chance of 1mm of drizzle means you will almost certainly need a hood, but your plans survive. A 40% chance of heavy showers means there is a real chance you get properly soaked, but also a decent chance you stay dry. The percentage is about likelihood; the rainfall figure is about intensity.
Timing often matters more than either. If there is a 30% chance of rain at 3pm and you will be out between 2pm and 4pm, plan for it. A low number repeated across six hours is not the same as a low number in one hour.
Temperature, and that 'feels like' figure
The temperature shown is the air temperature measured in the shade, away from direct sun and usually a metre or so above ground. That is why a bright, still winter day can feel warmer than the number suggests, and why a grey 8°C day with a stiff wind can feel bitterly cold.
The "feels like" figure combines air temperature with wind chill and humidity. On an exposed coastal path or a hilltop, this is the number to dress for. In a sheltered town centre on a sunny afternoon, the air temperature may be the better guide. If you are heading somewhere higher or more exposed than your starting point, assume it will be windier and colder than the forecast for your postcode.
Wind speed and gusts: the two numbers that matter
Wind forecasts usually give an average speed and a gust figure. The average is the sustained wind over a period, typically ten minutes. A gust is a brief peak, lasting only seconds, and it is the one that catches you out — flipping an umbrella, rattling a tent, or pushing a bike sideways on a bridge.
How to read them in practice
A steady 15 to 20mph wind is a brisk day: coats flap, cycling is harder work, and a picnic needs weighing down. If gusts are forecast at more than double the average, expect the day to feel far windier than the headline figure. Tall trees, exposed coastlines, hill ridges, motorway bridges and open car parks are where gusts bite hardest. Campers, caravanners, gardeners and anyone with a trampoline or a greenhouse should pay more attention to the gust number than the average.
Check your app's units before you panic. A forecast of 35 in kilometres per hour is a fresh breeze; 35 in miles per hour is a genuinely blustery day. Mixing the two is one of the most common mistakes.
Timing, confidence and warnings
The further ahead you look, the vaguer the forecast becomes. A detailed hour-by-hour picture for tomorrow is fairly reliable. A single icon for ten days' time is a broad hint, not a plan. If the big icon and the hourly list seem to disagree, trust the hourly detail, and check the radar for what is happening in the next hour or two.
Official weather warnings are worth reading in full rather than just noting the colour. They describe what is expected and where, so you can judge whether it affects your route, your garden or your journey home.
A quick routine for planning your day
- Check the units on wind and temperature first, so you are reading the right numbers.
- Look at the hour-by-hour list for the hours you will actually be out, not the whole day.
- Note the peak gust figure for the windiest part of your day.
- Check the "feels like" temperature for the time you leave the house.
- Glance at the radar if rain is nearby, and at any warnings for your area.
- Look out of the window before you commit. Local conditions beat a general forecast every time.
Two minutes of reading, rather than two seconds of glancing, is usually enough to decide between the light jacket and the waterproof, the bike and the bus, or the picnic and the pub.
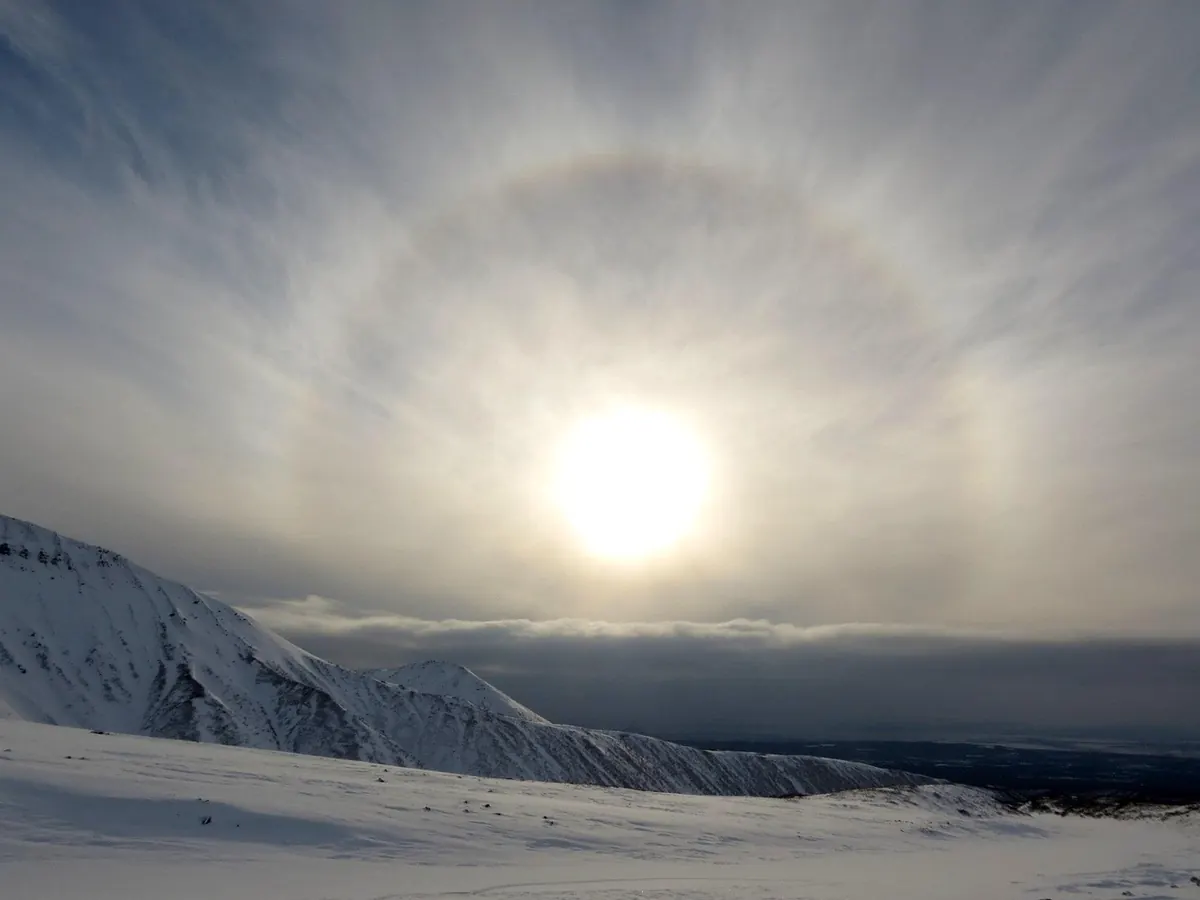
Photo: Natalia_Kollegova / Pixabay